
![]()

Compile Markdown files into beautiful CDL-themed Marp presentations. Includes the full Contextual Dynamics Lab slide theme with bundled fonts, images, and CSS.
| Title Slide | Callout Boxes | Tip & Warning |
|---|---|---|
 |
 |
 |
| Definition, Example & Important | Code Highlighting | Math (KaTeX) |
|---|---|---|
 |
 |
 |
| Manim Animations | Flow Diagrams | Emoji Figures |
|---|---|---|
 |
 |
 |
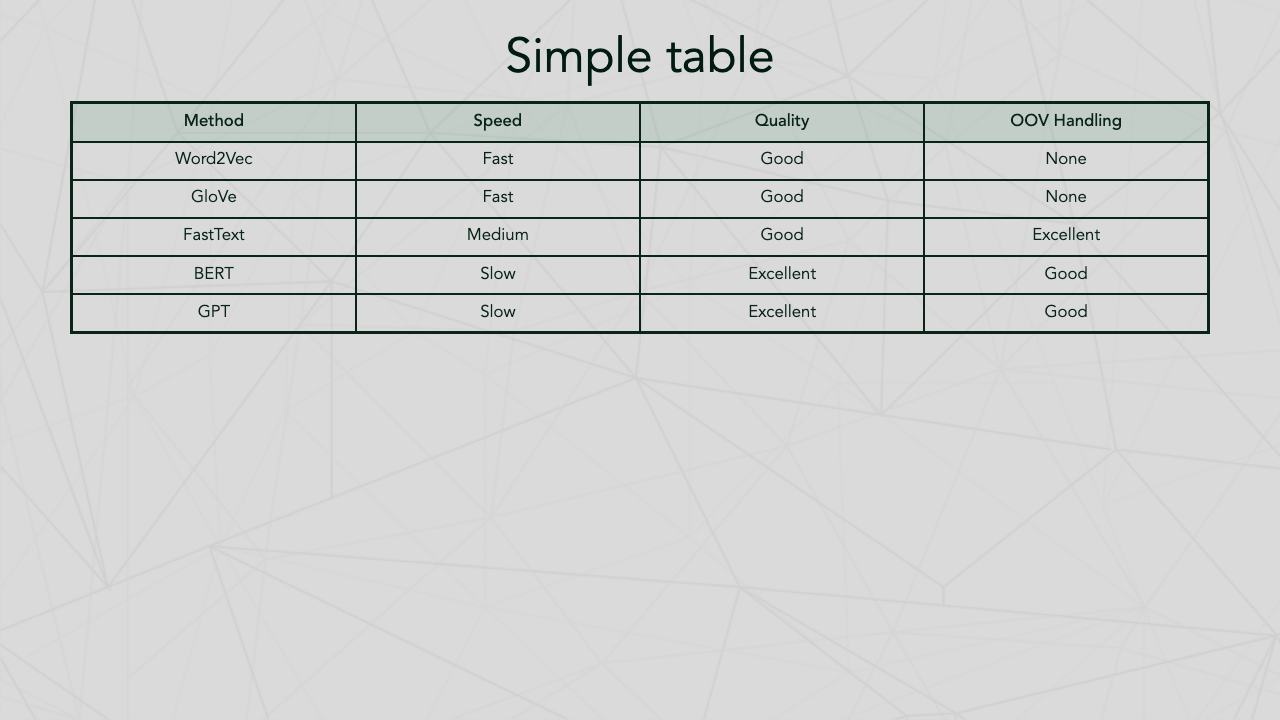
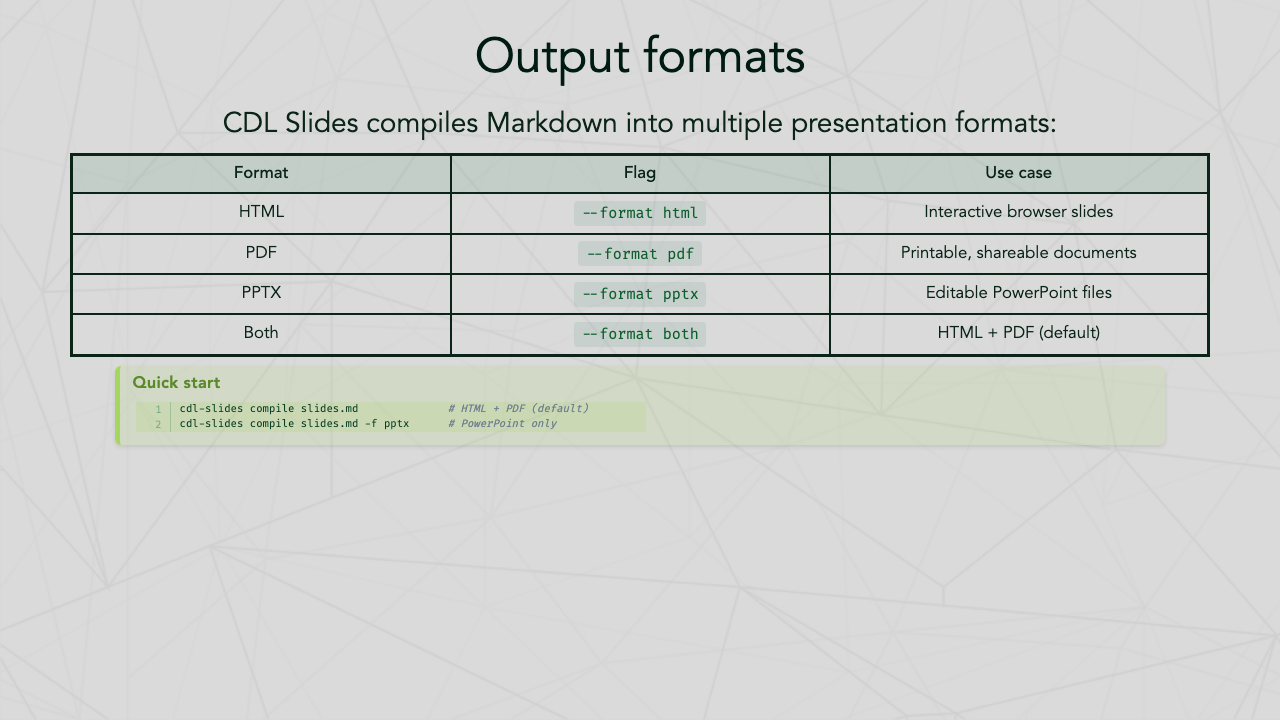
| Two-Column Layout | Simple Table | Output Formats |
|---|---|---|
 |
 |
 |
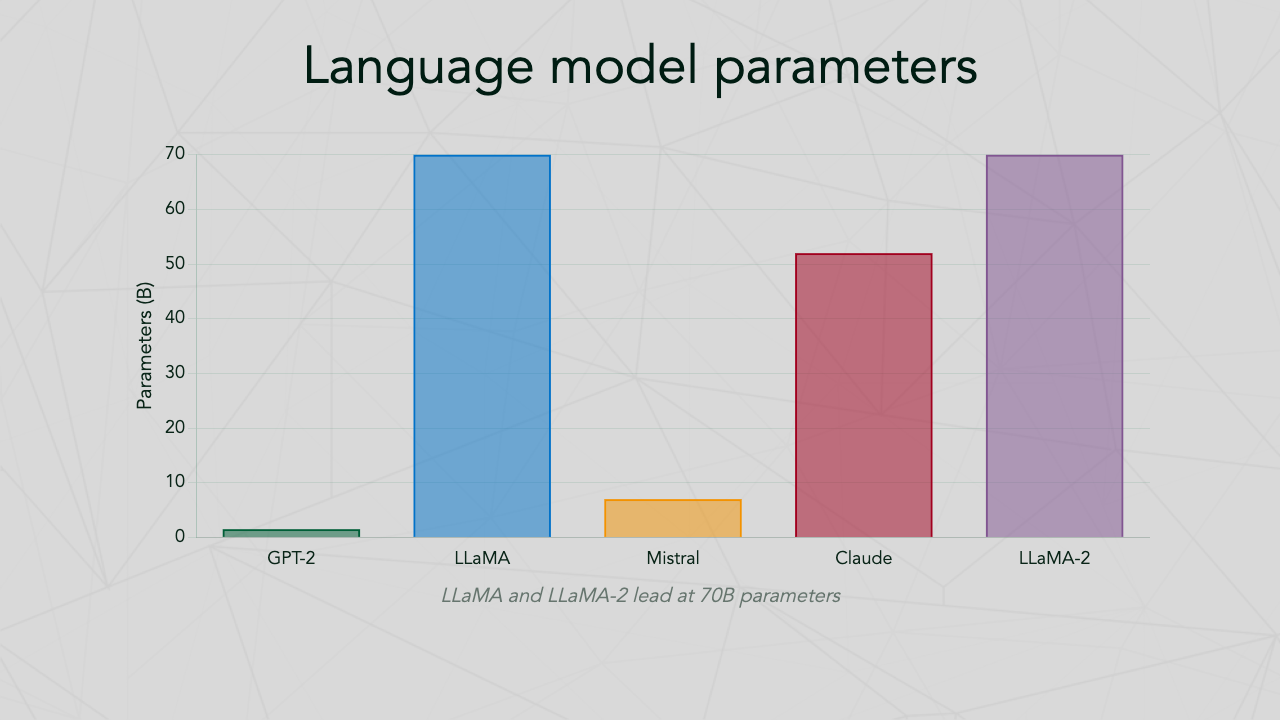
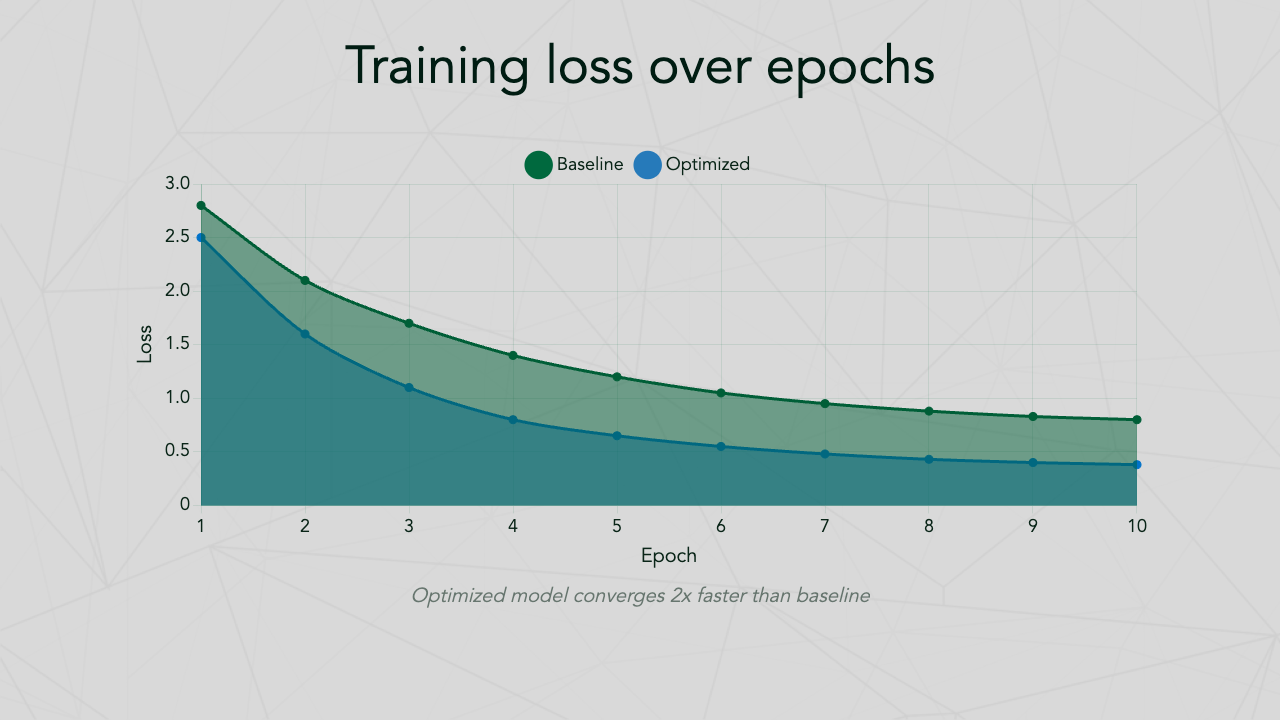
| Bar Chart | Line Chart | Grouped Bar |
|---|---|---|
 |
 |
 |
| Pie Chart | Doughnut Chart | Radar Chart |
|---|---|---|
 |
 |
 |
| Scatter Plot | Viridis Palette | Academic Poster |
|---|---|---|
 |
 |
 |
- Features
- Installation
- Quick start
- CLI reference
- Slide authoring guide
- Poster authoring guide
- Bundled fonts
- Development
- License
- Cross-platform: Works on macOS, Windows, and Linux
- Zero-config Marp CLI: Automatically downloads the Marp CLI standalone binary on first use — no Node.js required
- Multiple output formats: HTML, PDF, and PPTX
- Bundled theme: Complete CDL/Dartmouth-branded theme with custom fonts, colors, and layouts
- Smart preprocessing: Auto-splits long code blocks and tables across slides
- Flow diagrams: Simple
```flowsyntax for pipeline diagrams - Manim animations: Embed animated equations and visualizations with
```manimblocks (optional) - Auto-scaling: Automatically adjusts font size for dense slides
- Syntax highlighting: Code blocks with line numbers via Pygments
- Math support: KaTeX for inline and display equations
- Callout boxes: Note, tip, warning, definition, example, and important boxes
- Inline charts: Embed Chart.js charts with
```chartblocks — bar, line, scatter, pie, doughnut, radar, and more - Color palettes: 14 built-in palettes including CDL, seaborn, matplotlib, and colorblind-friendly options
- Academic posters: Compile poster markdown with ASCII grid layouts to HTML or PDF
- Auto-numbered captions: Poster compiler automatically labels figures and tables with bold Figure X. / Table X. prefixes
macOS:
brew install pango cairo ffmpeg
pip install cdl-slides
Linux (Debian/Ubuntu):
sudo apt-get install -y libpango1.0-dev libcairo2-dev ffmpeg
pip install cdl-slides
Windows:
pip install cdl-slidesThen run setup to download Marp CLI:
cdl-slides setupOr install from source:
git clone https://github.com/ContextLab/cdl-slides.git
cd cdl-slides
pip install -e .cdl-slides finds or installs Marp CLI automatically in this order:
- System PATH — uses your existing
marpinstall (npm, brew, etc.) - Cached binary — standalone binary downloaded on first use (~
~/Library/Caches/cdl-slides/on macOS,~/.cache/cdl-slides/on Linux,AppData\Local\cdl-slides\on Windows) - npx fallback — runs
@marp-team/marp-clivia npx if Node.js is available
To check your Marp CLI status:
cdl-slides version- Create a Markdown file with CDL theme front matter:
---
marp: true
theme: cdl-theme
math: katex
transition: fade 0.25s
author: Contextual Dynamics Lab
---

# My Presentation Title
### Subtitle

Your Name
Your Institution

---

# Slide Two

- Point one
- Point two
- Point three- Compile to HTML and PDF:
cdl-slides compile my_presentation.md- Output files are created alongside the input:
my_presentation.htmlmy_presentation.pdf
Compile a Markdown file into a presentation.
Usage: cdl-slides compile [OPTIONS] INPUT_FILE

Options:
  -o, --output PATH      Output file or directory (default: same dir as input)
  -f, --format TEXT       Output format: html, pdf, pptx, both (default: both)
  -l, --lines INTEGER     Max code lines per slide before splitting (default: 30)
  -r, --rows INTEGER      Max table rows per slide before splitting (default: 10)
  --no-split              Disable auto-splitting of code blocks and tables
  --keep-temp             Keep temporary processed files for debugging
  -t, --theme-dir PATH    Custom theme directory (overrides bundled CDL theme)
  --no-animations         Skip processing of animate blocks (useful for CI)
  --help                  Show this message and exit.
Examples:
# Compile to HTML only
cdl-slides compile slides.md --format html

# Compile to PDF only
cdl-slides compile slides.md --format pdf

# Compile to PowerPoint
cdl-slides compile slides.md --format pptx

# Compile with custom output location
cdl-slides compile slides.md --output ./build/

# Compile with custom code splitting threshold
cdl-slides compile slides.md --lines 15 --rows 5Create a new presentation from a template.
cdl-slides init                    # Create template in current directory
cdl-slides init ./my-presentation # Create template in specific directoryShow version and Marp CLI status.
cdl-slides versionPre-download the Marp CLI standalone binary. This is optional — Marp CLI is automatically downloaded on first compile if not already installed.
cdl-slides setupCompile a poster markdown file into HTML or PDF.
Usage: cdl-slides poster compile [OPTIONS] INPUT_FILE

Options:
  -o, --output PATH      Output file or directory (default: same dir as input)
  -f, --format TEXT       Output format: html, pdf, both (default: both)
  --keep-temp             Keep temporary processed files for debugging
  --help                  Show this message and exit.
Examples:
# Compile poster to HTML only
cdl-slides poster compile poster.md --format html

# Compile poster to PDF only
cdl-slides poster compile poster.md --format pdf

# Compile poster to both HTML and PDF
cdl-slides poster compile poster.md
Note: Posters support HTML and PDF output only (no PPTX). Math equations automatically use Avenir font to match poster typography.
Every CDL presentation starts with this YAML front matter:
---
marp: true
theme: cdl-theme
math: katex
transition: fade 0.25s
author: Contextual Dynamics Lab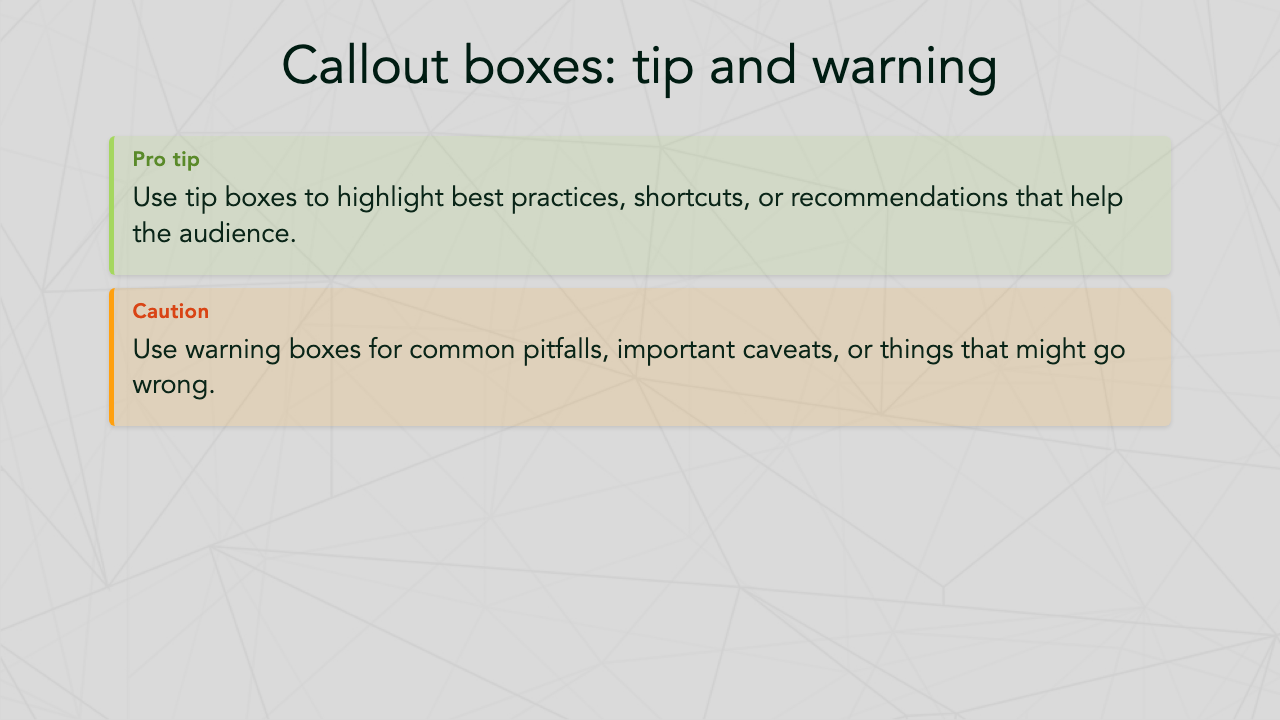
---The CDL theme includes six styled box types:
<div class="note-box" data-title="Title">
Content here with **Markdown** support.
</div>
<div class="tip-box" data-title="Pro Tip">
Helpful advice goes here.
</div>
<div class="warning-box" data-title="Caution">
Important warnings here.
</div>
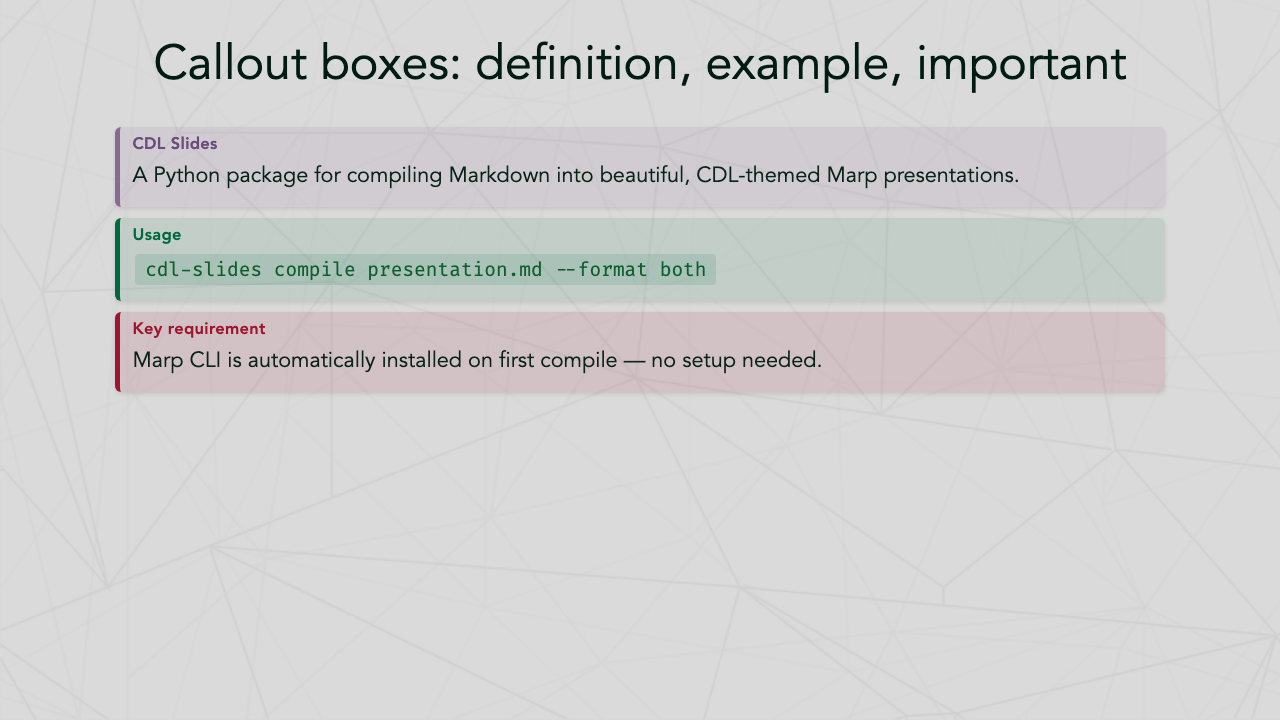
<div class="definition-box" data-title="Term">
Definition of the term.
</div>
<div class="example-box" data-title="Example">
A worked example.
</div>
<div class="important-box" data-title="Key Point">
Critical information.
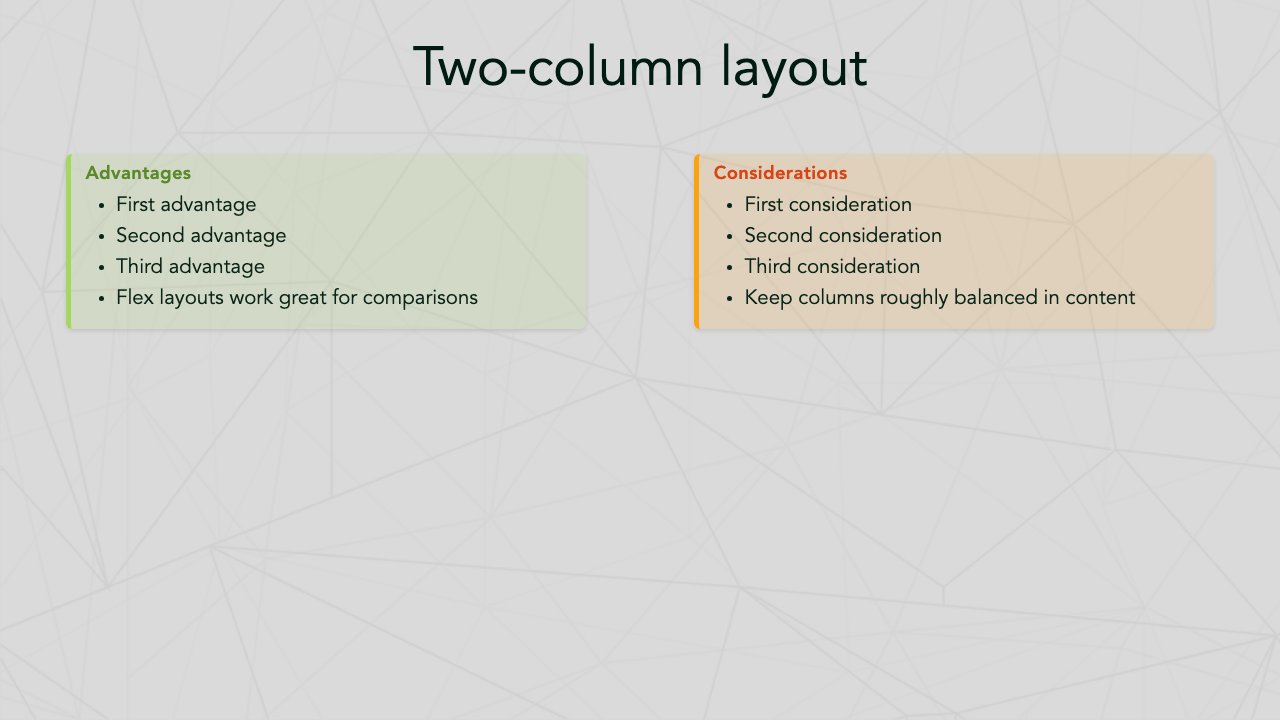
</div>For two-column content, wrap each column's content in a callout box for best results:
<div style="display: flex; gap: 1.5em;">
<div style="flex: 1;">

<div class="example-box" data-title="Left topic">

- First point
- Second point

</div>

</div>
<div style="flex: 1;">

<div class="example-box" data-title="Right topic">

- First point
- Second point

</div>

</div>
</div>
Any box type works (tip-box, warning-box, note-box, etc.). The boxes give columns clear visual boundaries and headers.
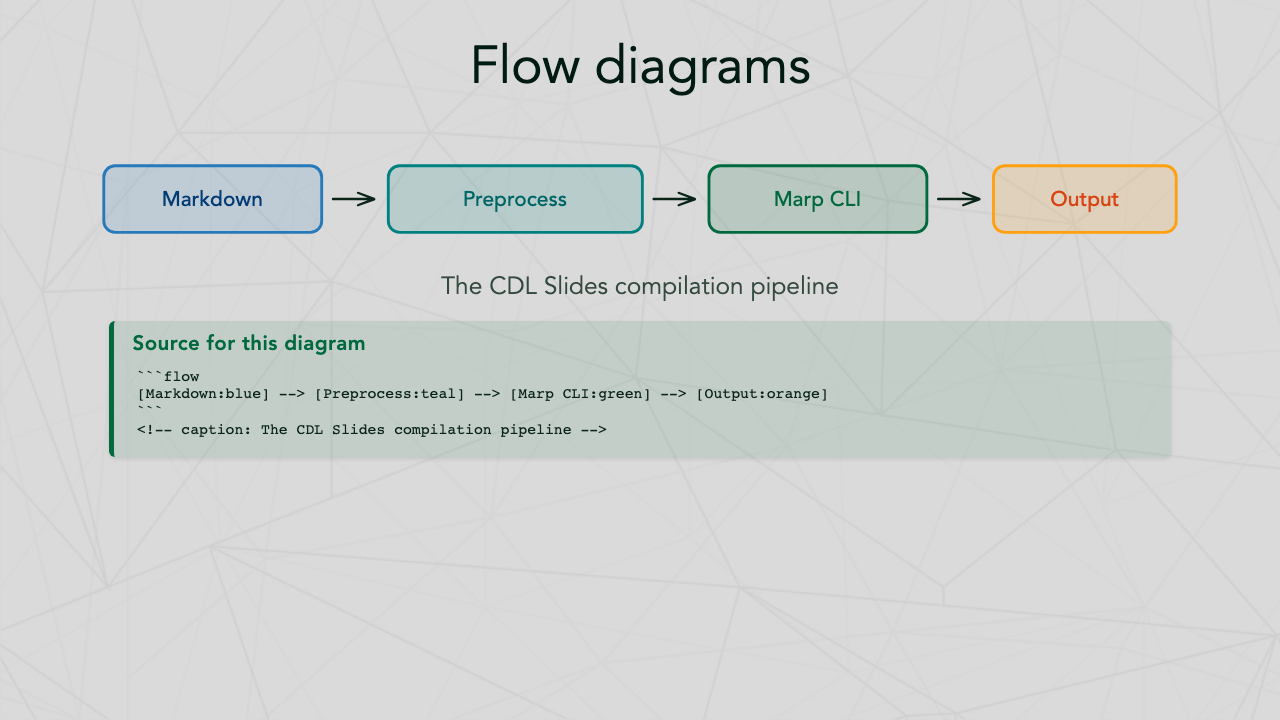
Use the ```flow syntax for simple pipeline diagrams:
```flow
[Input:blue] --> [Process:green] --> [Output:orange]
```
<!-- caption: A data processing pipeline -->
Available colors:
| Color | Alias | Description |
|---|---|---|
green |
— | Dartmouth Green (primary brand) |
blue |
river-blue |
River Blue |
navy |
river-navy |
River Navy |
teal |
— | Blue-green |
spring |
spring-green |
Spring Green |
rich-spring |
— | Rich Spring Green |
yellow |
summer |
Summer Yellow |
orange |
bonfire |
Bonfire Orange |
tuck |
tuck-orange |
Tuck Orange |
red |
bonfire-red |
Bonfire Red |
violet |
purple |
Violet |
brown |
autumn |
Autumn Brown |
gray |
granite, web-gray |
Granite Gray |
Embed animated math visualizations using the Animate DSL — a simple, declarative syntax that compiles to Manim Community. Animations are rendered to transparent GIFs and embedded in slides.
FFmpeg is bundled automatically via imageio-ffmpeg — no system ffmpeg installation required.
Usage:
```animate
height: 400
write equation "E = mc^2" as eq at center
wait 0.5
fade-in eq
```
The preprocessor automatically renders to GIF and embeds in your slide. Rendered GIFs are cached by content hash, so unchanged animations won't re-render.
The animate DSL provides a simpler alternative to writing raw manim Python code. It uses a declarative syntax that gets transpiled to manim automatically.
Basic equation example:
```animate
height: 400
write equation "E = mc^2" as eq1 at center
wait 0.5
fade-in eq1
```
Graph/plot example:
```animate
height: 400
create axes x=[0,6.28,1.57] y=[-1.5,1.5,0.5] as ax
plot "np.sin(x)" on ax color=blue as wave
```
Metadata options:
| Option | Default | Description |
|---|---|---|
| height | 500 | Image height in pixels |
| width | 960 | Image width in pixels |
| quality | high | Render quality (low/medium/high) |
| scale | 1.0 | Scale factor for equations and text (e.g., 2.5 for larger) |
Object commands:
| Command | Description | Example |
|---|---|---|
write equation "LaTeX" as NAME |
Create LaTeX equation | write equation "E = mc^2" as eq1 |
write text "string" as NAME |
Create text object | write text "Hello" as title |
create circle color=COLOR as NAME |
Create colored circle | create circle color=blue as c1 |
create square color=COLOR as NAME |
Create colored square | create square color=red as s1 |
create arrow color=COLOR as NAME |
Create colored arrow | create arrow color=green as a1 |
create axes x=[min,max,step] y=[min,max,step] as NAME |
Create coordinate axes | create axes x=[-3,3,1] y=[-1,1,0.5] as ax |
create graph "formula" x=[min,max] color=COLOR as NAME |
Create standalone function graph | create graph "x**2" x=[-2,2] color=red as parabola |
Plot commands:
| Command | Description | Example |
|---|---|---|
plot "formula" on AXES color=COLOR as NAME |
Plot function on existing axes | plot "np.sin(x)" on ax color=blue as wave |
Animation commands:
| Command | Description |
|---|---|
fade-in NAME |
Fade in an object |
fade-out NAME |
Fade out an object |
draw NAME |
Draw/create an object (for axes, graphs) |
transform NAME1 -> NAME2 |
Transform one object into another |
wait SECONDS |
Wait for specified duration |
Generic manim escape (for advanced use):
| Command | Description | Example |
|---|---|---|
manim <python_code> as NAME |
Execute any manim code | manim Dot().move_to(ax.c2p(1,1)) as dot |
Position modifiers:
| Modifier | Description |
|---|---|
at center |
Place at screen center |
above NAME |
Place above another object |
below NAME |
Place below another object |
left-of NAME |
Place to the left of another object |
right-of NAME |
Place to the right of another object |
Available colors: blue, red, green, yellow, orange, white, black
Animation support is included by default with pip install cdl-slides.
For dense slides, use scale directives to adjust font size:
<!-- _class: scale-80 -->
# Dense Slide Title

Lots of content here...
Available scales: scale-50 through scale-95 in increments of 5.
Note: The preprocessor auto-injects scale classes when slides overflow, so manual scaling is rarely needed.
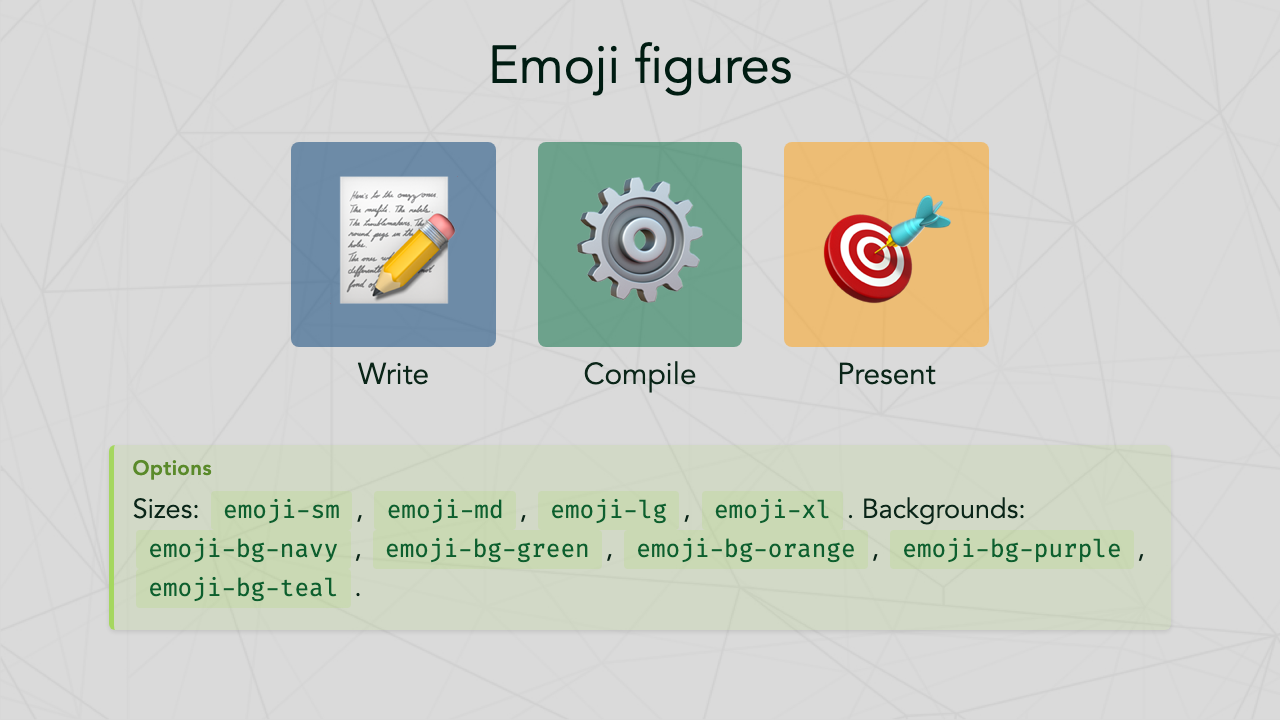
<div class="emoji-figure">
  <div class="emoji-col">
    <span class="emoji emoji-xl emoji-bg emoji-bg-navy">📊</span>
    <span class="label">Data</span>
  </div>
  <div class="emoji-col">
    <span class="emoji emoji-xl emoji-bg emoji-bg-green">🔬</span>
    <span class="label">Analysis</span>
  </div>
</div>
Available backgrounds: emoji-bg-navy, emoji-bg-green, emoji-bg-blue, emoji-bg-orange, emoji-bg-purple, emoji-bg-teal.
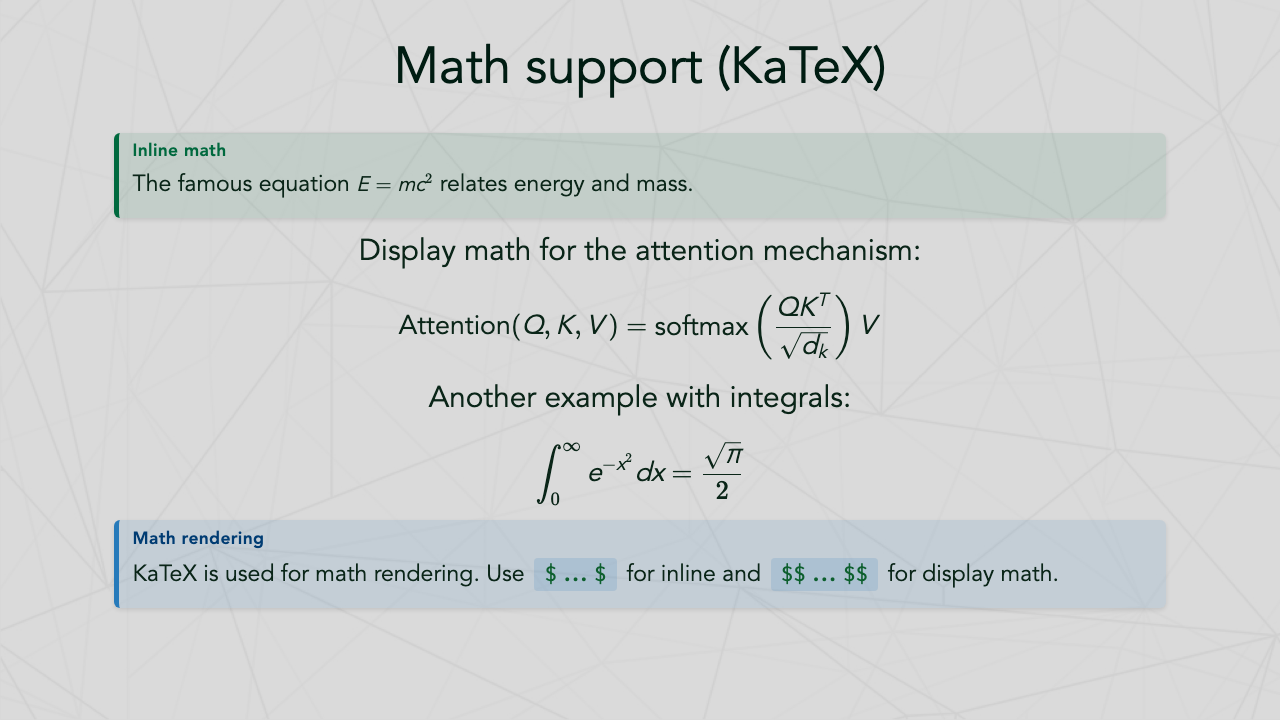
Inline: $E = mc^2$
Display:
$$\int_0^\infty e^{-x^2} dx = \frac{\sqrt{\pi}}{2}$$
Embed interactive Chart.js charts directly in your slides using ```chart blocks. Charts are automatically styled with CDL theme colors and fonts.
Basic example:
```chart
type: bar
labels: Q1, Q2, Q3, Q4
data: 120, 95, 140, 110
caption: Quarterly revenue
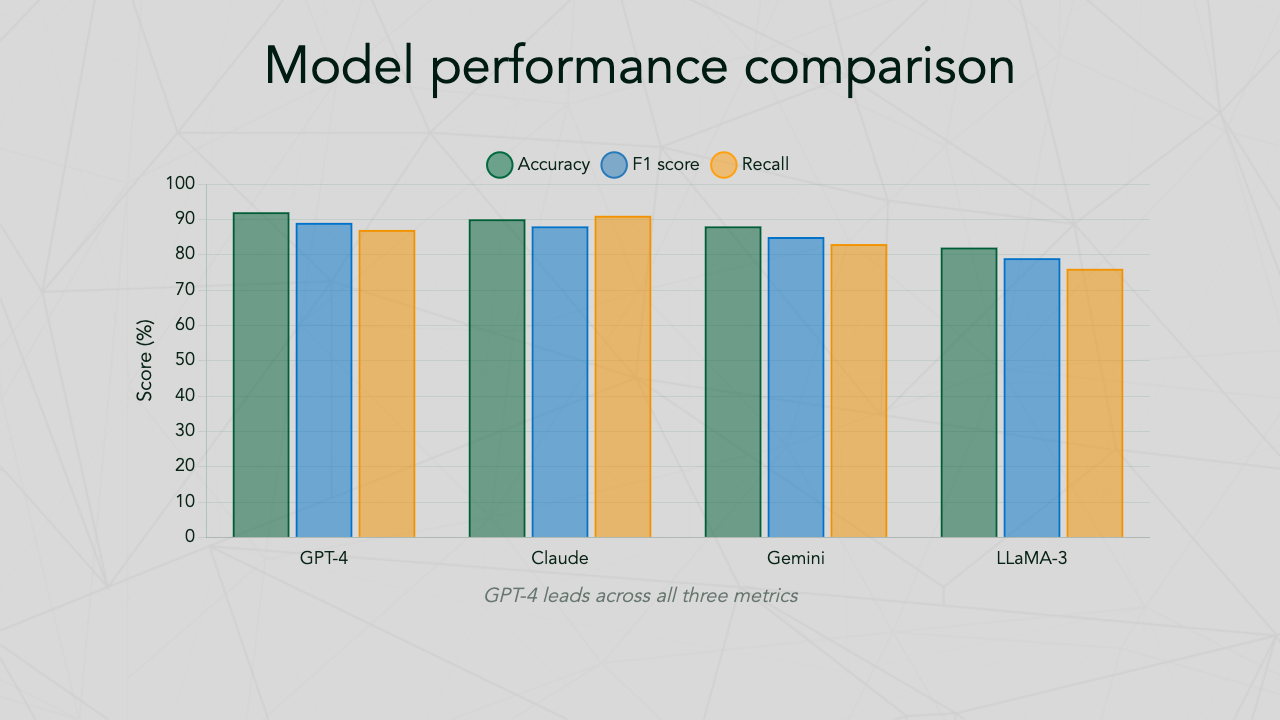
```Multi-dataset example:
```chart
type: line
labels: Jan, Feb, Mar, Apr, May
datasets:
  - label: Model A
    data: 82, 87, 91, 88, 93
  - label: Model B
    data: 75, 80, 85, 89, 92
palette: colorblind
caption: Model accuracy over time
```
Supported chart types:
| Type | Description |
|---|---|
bar |
Vertical bar chart |
line |
Line chart with smooth curves |
scatter |
Scatter plot |
pie |
Pie chart |
doughnut |
Doughnut chart |
radar |
Radar/spider chart |
For grouped bars, use multiple datasets with type: bar.
Chart options:
| Field | Default | Description |
|---|---|---|
type |
bar |
Chart type (see above) |
labels |
— | Comma-separated axis labels |
data |
— | Comma-separated values (single dataset) |
datasets |
— | Multiple datasets (see multi-dataset example) |
palette |
cdl |
Color palette name (see palettes below) |
alpha |
0.5 |
Fill opacity (0.0–1.0) |
caption |
— | Caption text centered below the chart |
xlabel |
— | X-axis label |
ylabel |
— | Y-axis label |
width |
85% |
Chart container width |
height |
350px |
Chart container height |
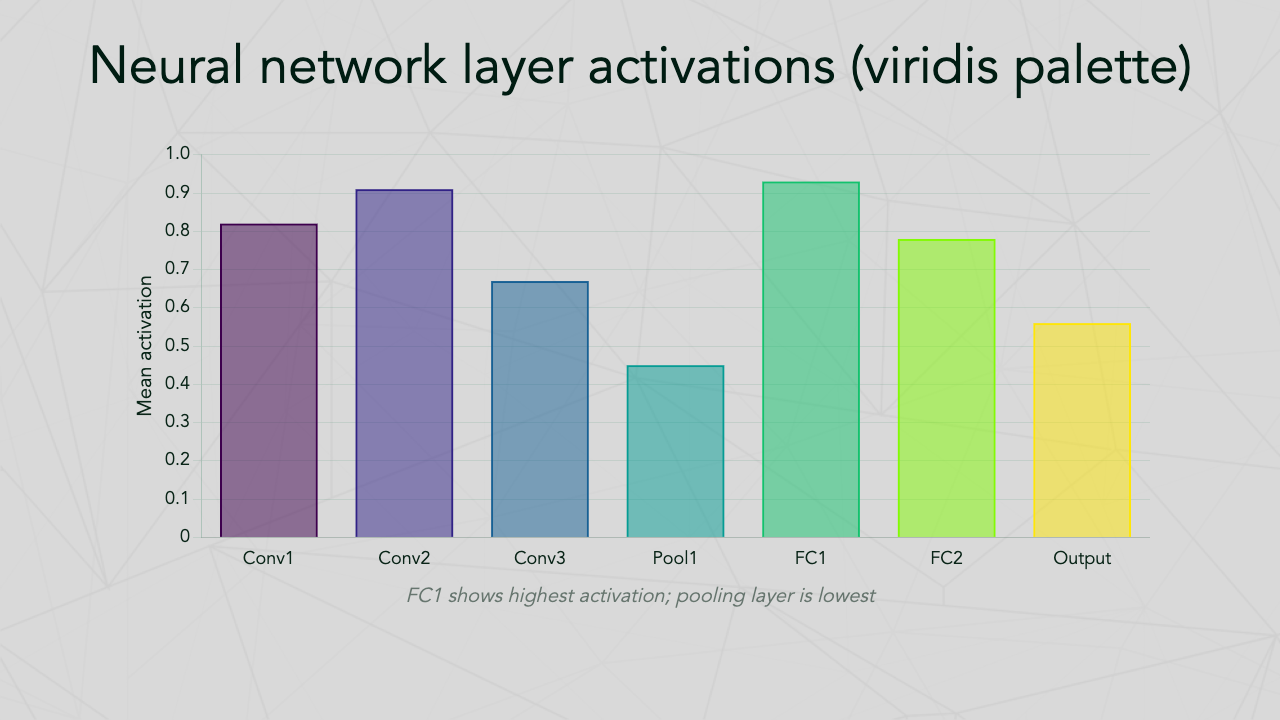
Axis labels example:
```chart
type: bar
labels: Conv1, Conv2, Pool1, FC1, Output
data: 0.82, 0.91, 0.45, 0.93, 0.56
palette: viridis
xlabel: Network layer
ylabel: Mean activation
caption: Average activations by layer
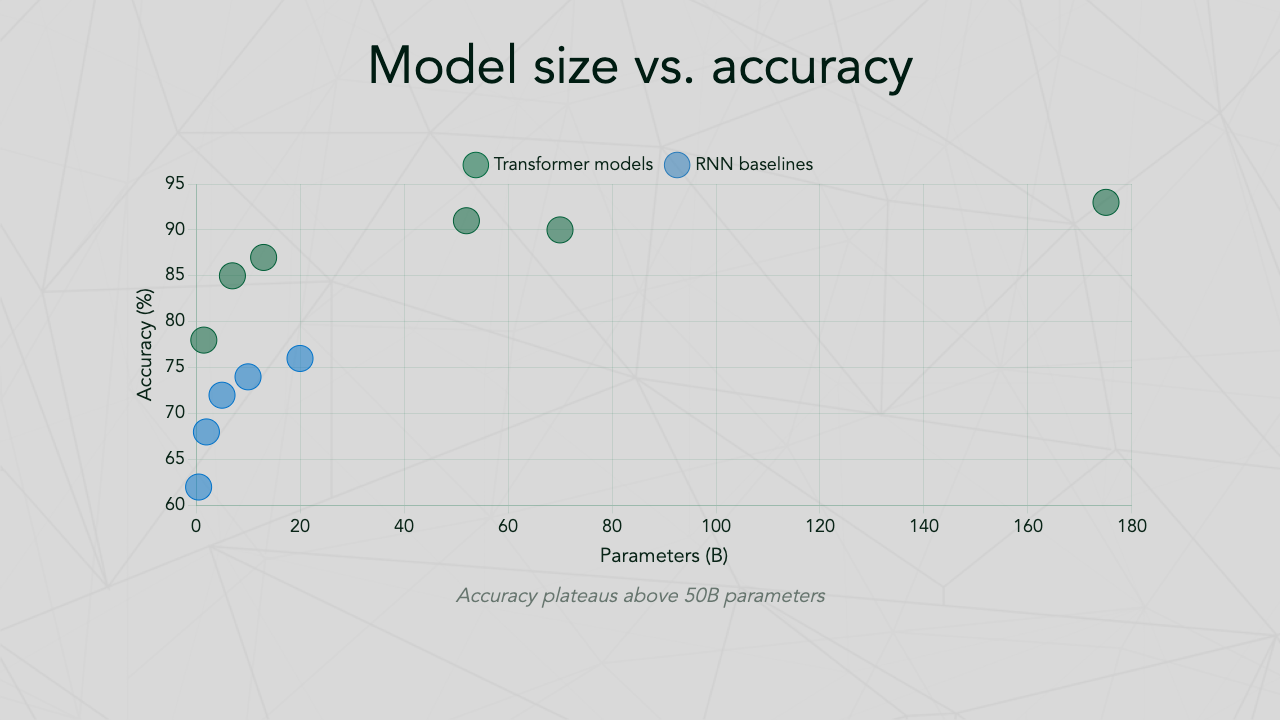
```Scatter plot example:
```chart
type: scatter
datasets:
  - label: Transformer models
    data: 1.5 78, 7 85, 13 87, 52 91, 70 90
  - label: RNN baselines
    data: 0.5 62, 2 68, 5 72, 10 74
xlabel: Parameters (B)
ylabel: Accuracy (%)
caption: Model size vs. benchmark accuracy
```
Scatter data uses x y pairs separated by commas (e.g., 1.5 78, 7 85).
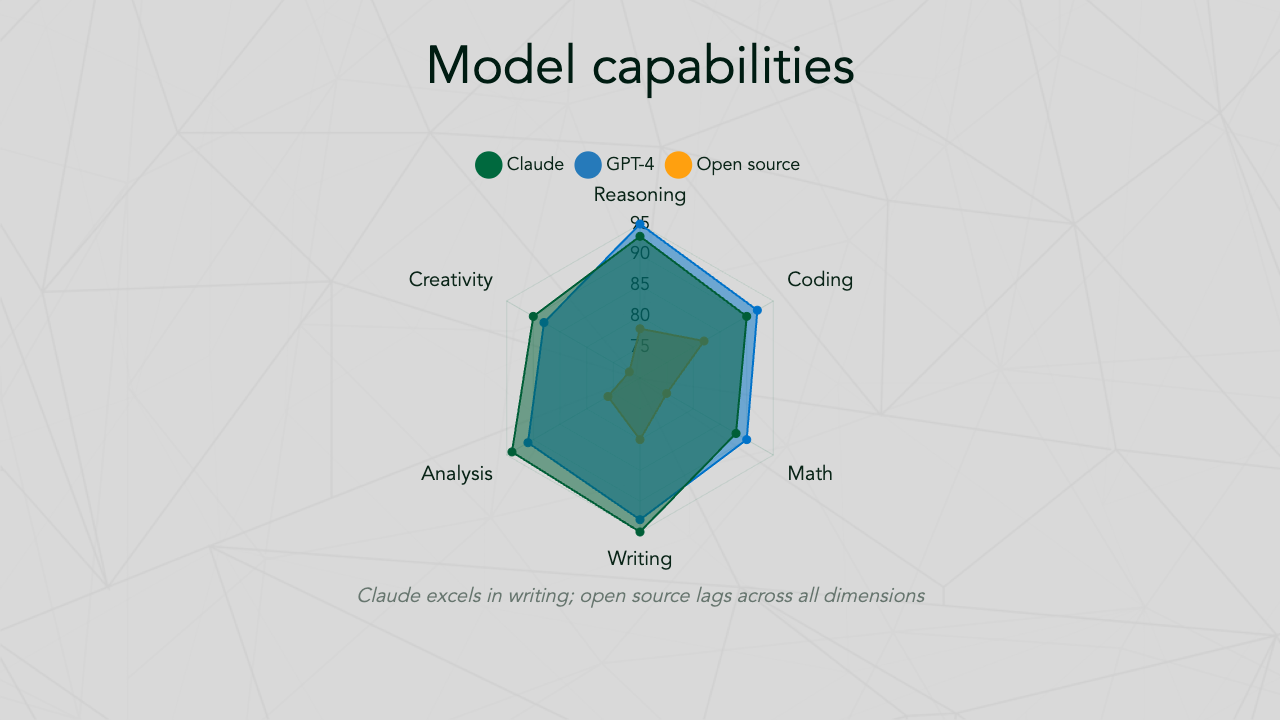
Radar chart example:
```chart
type: radar
labels: Reasoning, Coding, Math, Writing, Analysis
datasets:
  - label: Model A
    data: 95, 92, 90, 93, 91
  - label: Model B
    data: 78, 82, 75, 80, 76
caption: Capability comparison
```
Radar charts automatically render smaller datasets on top of larger ones for maximum visibility.
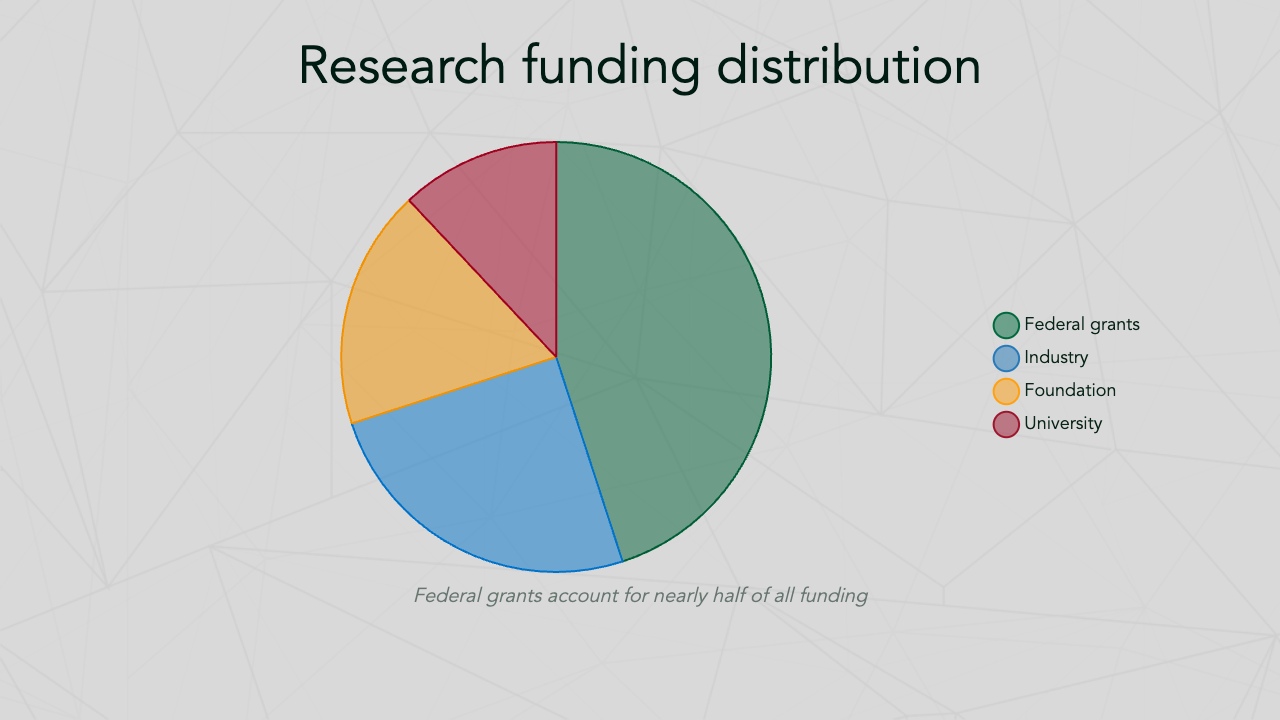
Pie and doughnut chart examples:
```chart
type: pie
labels: Federal, Industry, Foundation, University
data: 45, 25, 18, 12
caption: Funding sources
``````chart
type: doughnut
labels: Research, Teaching, Service, Admin
data: 40, 25, 20, 15
caption: Faculty time distribution
```Pie and doughnut charts display legends automatically.
Available palettes:
14 built-in palettes are available:
| Palette | Description |
|---|---|
cdl |
CDL/Dartmouth brand colors (default) |
tab10 |
Matplotlib Tab10 |
seaborn |
Seaborn default |
deep |
Seaborn deep |
muted |
Seaborn muted |
bright |
Seaborn bright |
colorblind |
Colorblind-friendly (seaborn) |
pastel |
Seaborn pastel |
dark |
Seaborn dark |
matplotlib |
Matplotlib default |
Set1 |
ColorBrewer Set1 |
Set2 |
ColorBrewer Set2 |
Set3 |
ColorBrewer Set3 |
Paired |
ColorBrewer Paired |
In addition to the built-in palettes, you can use any matplotlib colormap or seaborn palette by name. Colors are sampled automatically based on the number of chart elements (datasets for multi-dataset charts, labels for single-dataset bar/pie/doughnut charts).
Matplotlib colormaps: viridis, plasma, inferno, magma, cividis, twilight, coolwarm, Spectral, RdYlBu, RdYlGn, and all others.
Seaborn palettes: husl, hls, rocket, mako, flare, crest, and all others.
Charts also work inside poster sections — just use the same ```chart syntax in your poster markdown. In posters, charts are rendered as scalable vector graphics (SVG) using matplotlib for optimal print quality.
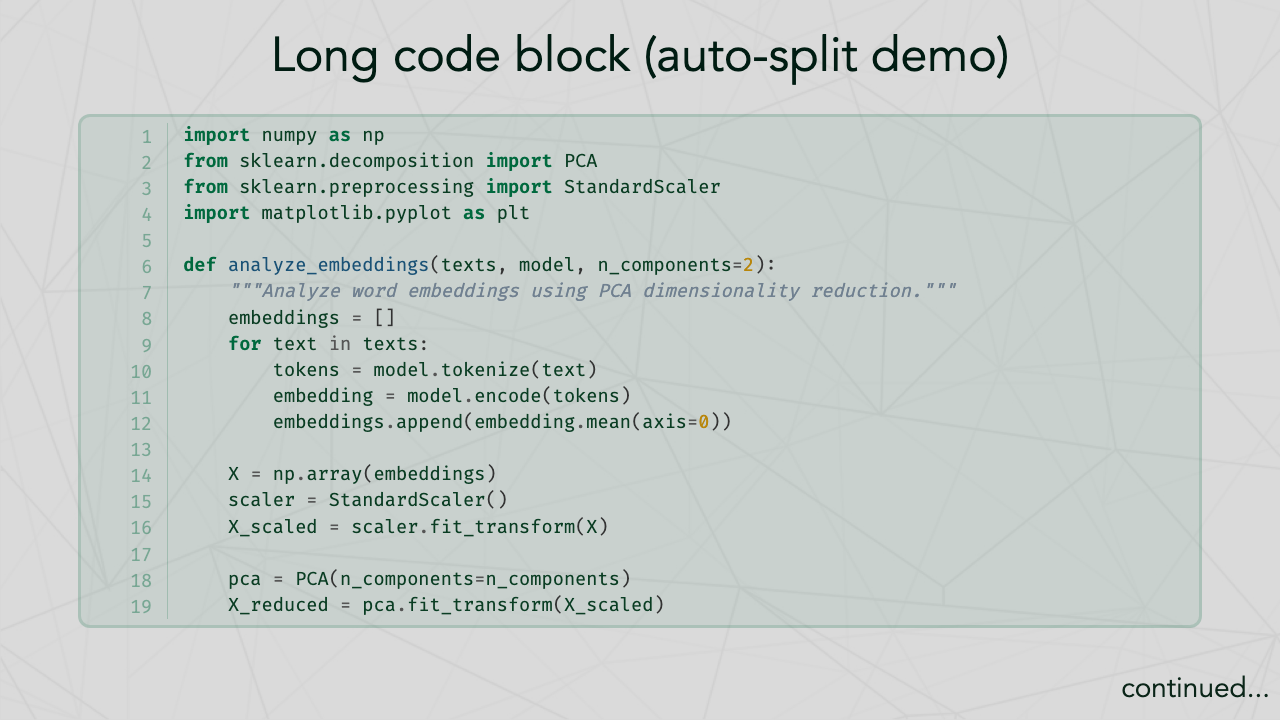
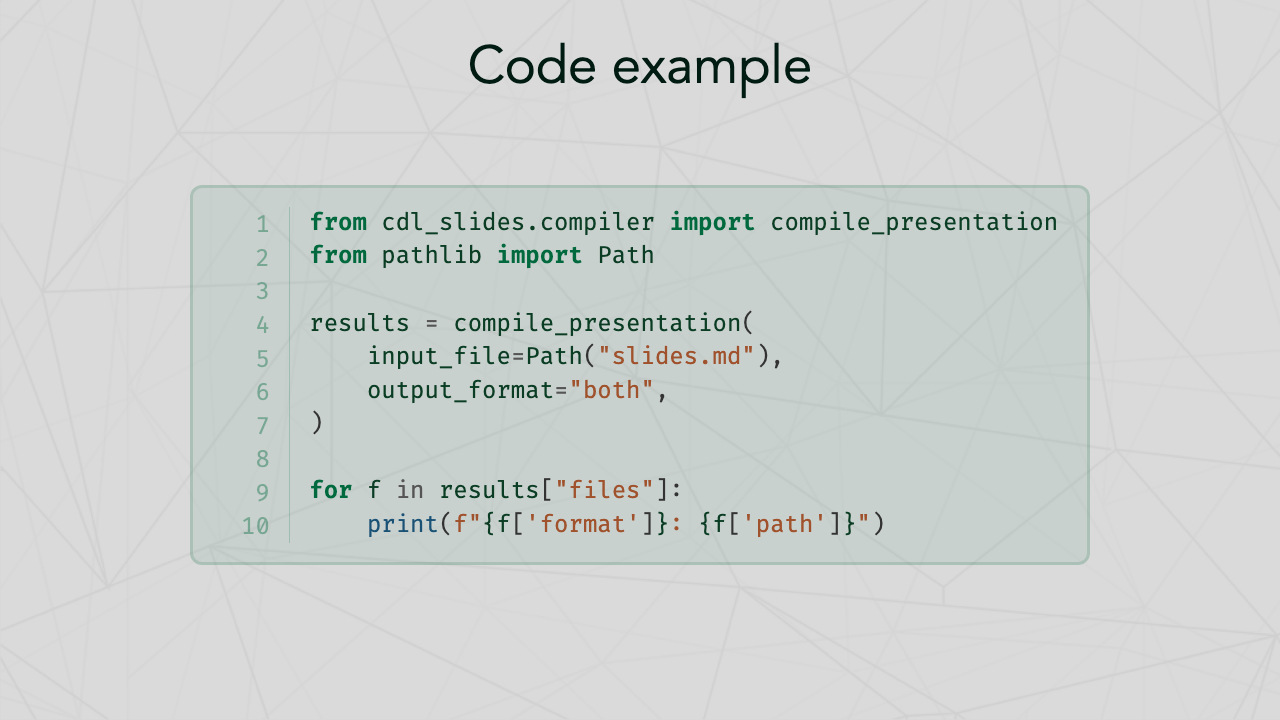
Code blocks are automatically:
- Syntax highlighted (via Pygments)
- Line numbered
- Split across slides if they exceed
--linesthreshold (default: 30)
Markdown tables are automatically split across slides if they exceed --rows threshold (default: 10 data rows).
Use arrow shorthand in slides:
A --[80]-> B --[lg]-> COptions: --[80]-> (pixel width), --[lg]-> (named size: sm, md, lg, xl).
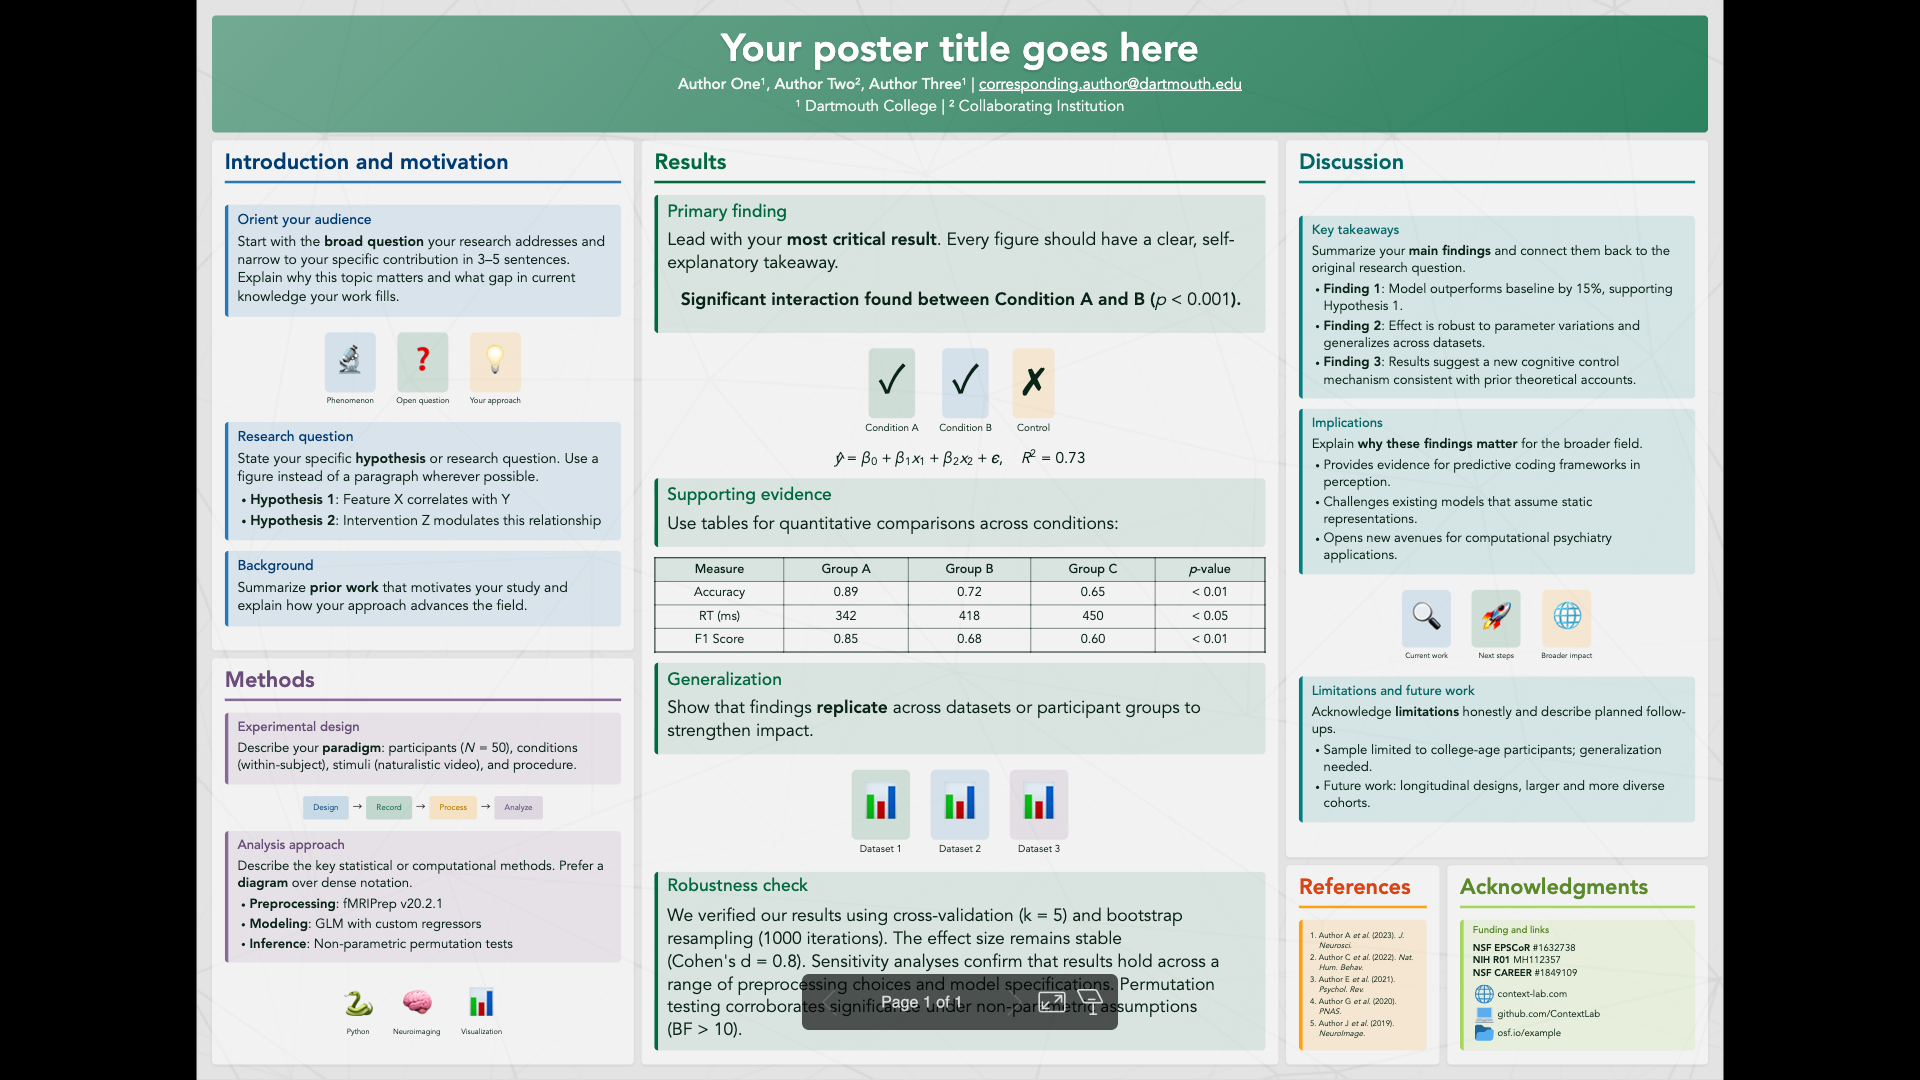
Create academic posters with ASCII grid layouts. See examples/sample_poster.md for a complete example.
---
marp: true
theme: cdl-poster
size: A0
math: katex
---
Available sizes: A0 (landscape, default), A0-portrait, A1, 48x36, 36x48, or any WxH pattern.
Define your poster layout with a poster-layout code block. Each letter represents a section, and its area on the grid determines its position and size:
```poster-layout
TTTTTTTTTTTTTTTTTTTTTTTTTTTT
IIIIIIIIRRRRRRRRRRRRDDDDDDDD
IIIIIIIIRRRRRRRRRRRRDDDDDDDD
MMMMMMMMRRRRRRRRRRRRDDDDDDDD
MMMMMMMMRRRRRRRRRRRREEEEAAAA
```
Each letter maps to a ## X: Section Title heading in your markdown. The number of rows and columns a letter spans determines the relative size of that section.
Define sections with ## X: Title syntax, where X matches a letter from the grid:
## T: Your poster title goes here

**Author One**¹, **Author Two**² | email@institution.edu

¹ Dartmouth College | ² Collaborating Institution

## I: Introduction [blue]

Content with **Markdown**, callout boxes, emoji figures, math, and tables.

## M: Methods [violet]

Use callout boxes, flow diagrams, and emoji figures inside sections.

## R: Results [green]

$$\hat{y} = \beta_0 + \beta_1 x_1 + \epsilon$$

## D: Discussion [teal]

Callout boxes work inside poster sections just like in slides.

## E: References [orange]

1. Author A, Author B (2023). *Journal* 1:1-10.

## A: Acknowledgments [spring]

Supported by **NSF** #1234567.
The T section renders as the title bar. All other sections render as content panels with section headings. Use <div class="scale-80"> wrappers to adjust font size within sections.
Add [color] after a section title to set its callout box color scheme:
## I: Introduction [blue]
## M: Methods [violet]
## R: Results [green]
Available colors: blue, green, violet/purple, orange, red, teal, spring.
Colors affect the section heading border, callout box backgrounds, and callout box borders. Individual boxes can override with data-color="..." on the div.
The poster compiler automatically prepends bold Figure X. and Table X. labels to caption elements. Use figure-caption or table-caption classes on <div> or <p> tags:
<div class="figure-caption">Description of the figure</div>
<div class="table-caption">Description of the table</div>
These render as:
Figure 1. Description of the figure
Table 1. Description of the table
Numbering increments automatically in document order. The labels use non-breaking spaces to prevent line breaks between the number and caption text.
The package includes these fonts for consistent rendering across platforms:
- Avenir LT Std (Light, Book, Roman, Medium, Heavy, Black) — body text
- Fira Code (Regular, Medium, Bold) — code blocks
- Noto Sans SC (Variable) — CJK character support
# Clone and install in development mode
git clone https://github.com/ContextLab/cdl-slides.git
cd cdl-slides
pip install -e ".[dev]"

# Run tests
pytest tests/ -v

# Run linter
ruff check src/ tests/
ruff format src/ tests/MIT License. See LICENSE for details.
- Repository: https://github.com/ContextLab/cdl-slides
- Lab Website: https://www.context-lab.com
- Marp: https://marp.app/